The Little-Known Landing Page Mistakes Heat Maps Can Expose
Rather than relying on guesswork or general best practices, heat maps deliver concrete evidence of what works and what doesn’t, allowing for data-driven optimization decisions.
The Four Essential Heat Maps for Landing Page Analysis
1. Click Maps: Identifying Action Points
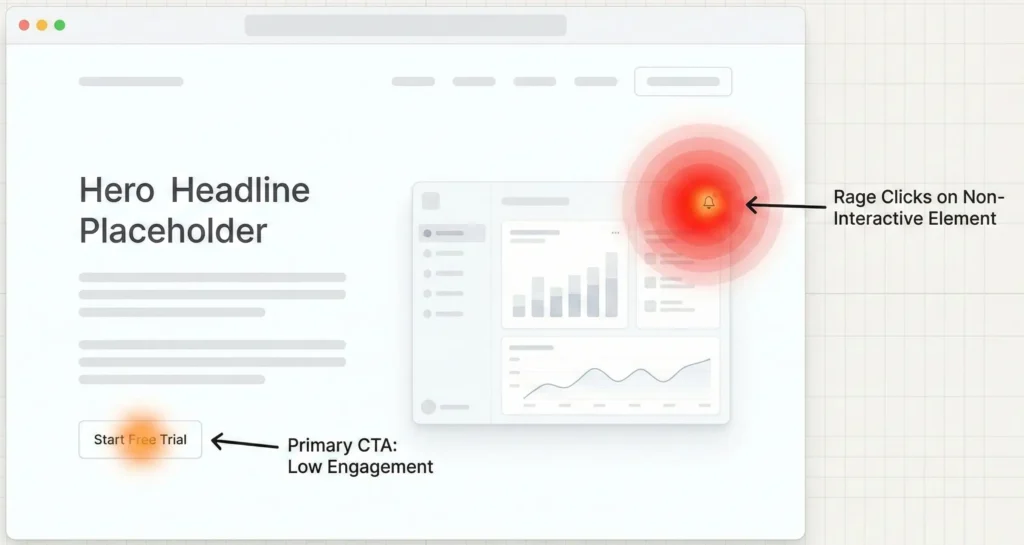
Click maps reveal exactly where visitors are clicking on your landing page, highlighting which elements draw user attention and which are being ignored.
Key insights for landing pages:
- Determine if your primary CTA button is receiving adequate attention
- Identify distracting elements that receive clicks but don’t contribute to conversions
- Discover if users are clicking on non-clickable elements (indicating confusion)
- Validate the effectiveness of secondary CTAs against your primary conversion goal
Optimization tip: If your heat map shows clicks scattered across multiple elements, consider simplifying your landing page to direct focus toward your primary call-to-action.
2. Scroll Maps: Finding the Visibility Threshold
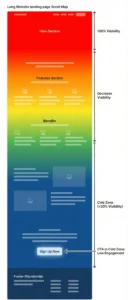
Scroll maps show how far down your landing page visitors typically scroll, revealing whether your key messages and CTAs are being seen.
Critical applications for landing pages:
- Determine if users are seeing your primary CTA
- Identify the optimal placement for key benefit statements
- Find the point where visitor engagement significantly drops
- Assess whether long-form content is being consumed
Optimization tip: If your scroll map shows that only 20% of visitors reach the bottom of your page where your main CTA sits, consider repositioning it above the fold or adding multiple CTAs throughout the page.
3. Mouse Movement Maps
Mouse movement maps track cursor paths, which closely correlate with eye movement patterns, revealing which elements capture visitor attention even without clicks.
Strategic insights:
- Identify which headlines and images draw immediate attention
- Discover if visitors are reading key benefit statements
- Determine if visual elements are guiding attention toward or away from CTAs
- Find areas of interest that could be leveraged for better conversion
Optimization tip: If mouse movement clusters around certain product features but not your value proposition, consider revising your messaging to better align with visitor interests.
4. Attention Maps
Attention maps combine various interaction data to show which sections receive the most overall engagement, highlighting both strengths and weaknesses in your landing page design.
Valuable applications:
- Identify which sections engage visitors most effectively
- Discover which elements might be distracting from your conversion goal
- Determine if your page design naturally guides visitors toward conversion
- Find opportunities to enhance underperforming sections
Optimization tip: If attention maps show engagement dropping precisely where your pricing information appears, consider revising how you present your offer.
Five Landing Page Elements to Analyze with Heat Maps
1. Headlines and Value Propositions
Your headline often creates the critical first impression. Heat maps can reveal whether visitors are engaging with this content or skipping past it.
What to look for: Mouse movement patterns that indicate users are reading and processing your headline, rather than immediately scrolling past it.
2. Call-to-Action Buttons
CTAs are the conversion engine of your landing page. Click maps specifically show whether your CTAs are receiving the attention they deserve.
What to look for: High density click areas on your primary CTA button. If secondary elements are receiving more clicks than your main CTA, reconsider your page design and hierarchy.
3. Form Fields
For lead generation landing pages, form optimization is crucial. Heat maps can reveal which form fields cause hesitation or abandonment.
What to look for: Mouse movement patterns that show users hovering over specific fields for extended periods (indicating confusion) or abandoning the page at certain form fields.
4. Images and Visual Elements
Visual elements should support conversion goals, not distract from them. Heat maps show whether your images enhance or detract from the user experience.
What to look for: Attention patterns that show images drawing focus away from key conversion elements or, ideally, guiding attention toward your CTA.
5. Social Proof Elements
Testimonials, reviews, and trust badges can significantly impact conversion rates. Heat maps reveal whether visitors are engaging with these elements.
What to look for: Mouse movement and click patterns around testimonial sections, indicating visitors are seeking validation before converting.
Case Study: Landing Page Transformation Through Heat Map Analysis
A SaaS company observed a consistently low conversion rate (1.8%) on their primary product landing page despite driving quality traffic through paid campaigns. After implementing heat map analysis, they discovered several critical issues:
- Their primary CTA was positioned below the fold, with scroll maps showing only 40% of visitors scrolled far enough to see it
- Click maps revealed visitors were clicking on product screenshots that weren’t actually clickable
- Mouse movement maps showed visitors spending time reading pricing details but then abandoning the page without exploring further
Optimization actions taken:
- Repositioned the primary CTA above the fold
- Made product screenshots clickable, opening an interactive demo
- Simplified pricing presentation and added a satisfaction guarantee
Results: Within two weeks of implementing these changes, the landing page conversion rate increased to 4.3%—a 139% improvement—without any changes to traffic sources.
Best Practices for Landing Page Heat Map Analysis
1. Collect Sufficient Data
For reliable heat map analysis, ensure you have data from at least 2,000-3,000 visitors (or 2-4 weeks of traffic for lower-traffic pages). Small sample sizes can lead to misleading conclusions.
2. Segment Your Analysis
Different traffic sources often behave differently. Segment your heat map data by:
- Traffic source (paid ads, email, organic)
- Device type (desktop vs. mobile)
- New vs. returning visitors
3. Test Before and After Optimization
Run heat map analysis both before and after making changes to validate that your optimizations have actually improved user behavior patterns.
4. Combine Heat Maps with Traditional Analytics
Heat maps provide the “what” of user behavior, while traditional analytics and user testing can help explain the “why.” Use them together for comprehensive insights.
5. Focus on One Optimization at a Time
When making changes based on heat map insights, implement one significant change at a time so you can accurately attribute improvements to specific optimizations.
By understanding exactly how visitors interact with your landing pages where they click, how far they scroll, what captures their attention, and what they ignore you can create highly optimized pages that convert at significantly higher rates.